Introducing BioLegend’s Multiomics Analysis Software
Analyzing single-cell multiomics data often requires advanced tools and extensive expertise. The ability to successfully analyze data can depend on the availability of lab resources and a researcher’s comfort level with the application. To make single-cell data analysis easier, we have developed Multiomics Analysis Software (MAS), a free, cloud-based program to quickly and easily explore CITE-seq data without needing an in-depth bioinformatics background.
Features of MAS
Multiomics Analysis Software (MAS) is a free cloud-based program for exploring single-cell proteogenomics data generated using TotalSeq™ antibodies in conjunction with 10x Genomics' single-cell RNA workflows. Features of the software include:
- A simple user interface for exploring CITE-seq data.
- Accessible to all users irrespective of bioinformatics background.
- Accessible through your web browser, no server access required.
- Uses flow cytometry-like gating based on TotalSeq™ antibody staining.
- Creates UMAP, tSNE, or TriMAP dimensionality reduction plots.
- Easily share any workspace with collaborators or BioLegend Technical Services.
- Export project in *.h5ad format for use in other single-cell analysis programs.
To access MAS, request an account under the “Access the Software” tab. If you have an account, you can login or download the user guide.
What Can MAS Do?

Single-Cell Multiomics Workflow
 Cells are stained with TotalSeq™ antibodies and processed through 10x Genomics' Feature Barcode workflow. Sequencing libraries are generated and sequenced on an Illumina platform.
Resulting sequencing data, either *.bcl or fastq files, are analyzed using Cell Ranger, which produces feature counts in the form of feature-barcode matrices. These matrices are uploaded into MAS for the exploration of single-cell proteogenomic data.
Getting Started with MAS
If you’d like to start exploring the software, but don’t have single-cell data to explore, download this dataset and scroll down to follow our video tutorial.
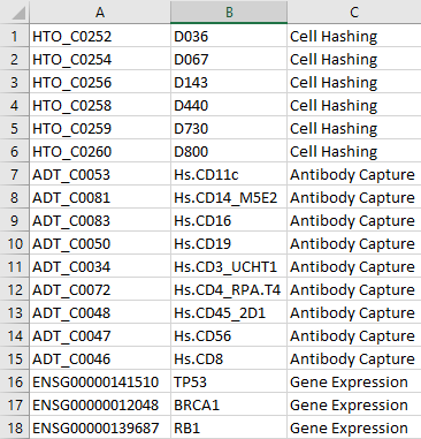
If you have a feature barcode matrix you’d like to explore, request an account under the "Access the Software" tab. Make sure the Features.tsv.gz file adheres to the following guidelines:
- Rows containing cell hashing antibodies, need to have “HTO_###” in column A and “Cell Hashing” listed in column C
- Rows containing non-cell hashing antibodies, need to have “ADT_###” in column A and “Cell Hashing” listed in column C
Download the MAS User Guide
Recommended MAS Workflow
- Upload data to MAS.
- Review demultiplexing results. MAS automatically demultiplexes data by sample and filters cells based on UMI complexity.
- Perform RNA analysis to create thresholds for inclusion of genes in downstream analysis and normalize gene expression.
- Add gates to clean up data and define cell populations of interest.
- Generate dimensionality reduction plots, including UMAP, tSNE, and TriMap plots.
- Cluster cells using community detection algorithms to understand cellular heterogeneity.
- Using these interactive plots, explore data and perform differential expression analysis between cell clusters.